The North-South Trade Corridor Reshuffle: Tracking Container Freight Volumes and Lead Times as Shippers Avoid the Red Sea

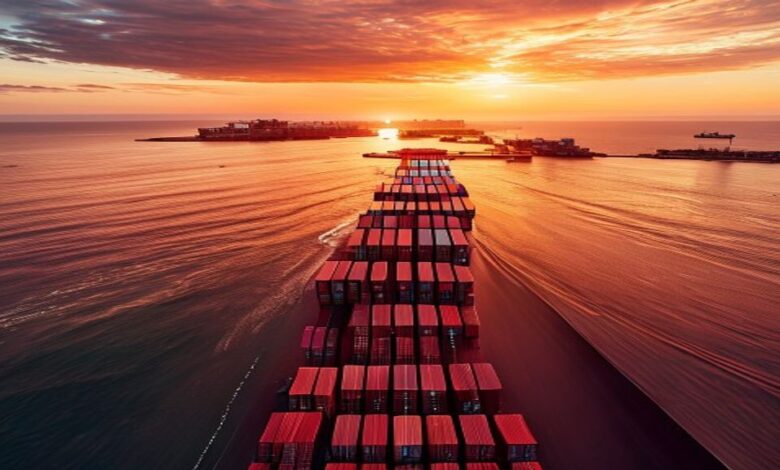
In early 2024, I sat in a logistics command center anxiously observing the first containers that had previously been en route via Suez Canal diverting to avoid Russia. At that time, we thought this diversion would last no longer than a couple of weeks, but now we realize it has gone on for three years! By mid-2026, the global trade landscape has literally transformed; therefore, if you do not have access to this data, you are essentially blindfolded running through a hurricane.
Challenge: Current Global Supply Chain Systems are incurring a permanent tax on long-haul freight due to the fact that the most efficient route from Asia to Europe is currently closed to the commercial shipping of freight.
Limitations: As a result of the significant increase in fuel costs, substantial delays in shipments (due to port congestion at secondary ports), and the uncertainty of port congestion, shippers find themselves balancing all three of these risks when determining how to move goods from Asia to Europe.
Solution: Shippers must change their strategies by embracing the use and importance of real-time (up-to-the-minute) data tracking; developing a mixed carrier approach; and realizing “Just-in-Time” inventory is dead and will be replaced by a “Just-in-Case” approach to creating resiliency.
Prerequisites for Navigating This Market
In order to be successful in navigating this new market, the following three resources must be utilized by shippers:
A freight intelligence platform (e.g.; Freightos) must be used to track and analyze available truckload spots.
A clear understanding of your own “buffer stock” needs (the total quantity of product you need in inventory based on current and predicted demand, as well as forecasted lead times) must exist.
A shipper must be able to track the exact location (real-time) of their cargo by subscribing to MarineTraffic or an equivalent AIS Starfinder.
Understanding the Global Logistics Shift: Why Shippers Are Diverting
The Geopolitical Catalyst: Red Sea Security and Insurance War Risk Premiums
The current shift isn’t only due to safety reasons; it’s also related to the costs associated with the increased amount of risk. As all nations turned the Red Sea into a combat zone, the insurance war risk premium significantly increased making it economically unviable for many carriers to transit through the Suez Canal. Insuring a vessel’s hull is not the only increase, but cargo insurance and crew hazard pay will now need to be included. Thus, these costs will transfer directly to shippers, therefore making a standard voyage an economic gamble.
Mapping the New Normal: Cape of Good Hope Transit Increase
This increase in Transit Traffic at the Cape of Good Hope transit increase is the “new normal.” When vessels sail around the southern tip of Africa, they will now need to add approximately 3,500 Nautical Miles to their journey; consequently, this will significantly increase the amount of Bunker Fuel consumed and limit the number of available round trips a single vessel can make in an annual period.
Analyzing Red Sea diversion container shipping volumes 2026 data
Comparative Analysis: Suez Canal Revenue Collapse vs. Alternative Routes
The Suez Canal revenue collapse was massive. As the volume of traffic through the Suez Canal dropped off, the Egyptian Government lost its primary source of Foreign Currency; therefore, this has created ripples in regional financial markets. On the other hand, other routes not utilizing the Suez Canal have experienced record volume levels leading to a complete shift in how Global Trade is currently routed.
Tracking the Shanghai Containerized Freight Index (SCFI) Trends
To track where the market is headed, check the Shanghai Containerized Freight Index (SCFI).
Trend: When SCFI spikes, it is generally a warning sign of a capacity crunch.
Divergence: Previously, SCF was closely aligned to the average rate to transit through the Suez Canal; however, in 2026 there is significant divergence because spot rates now have the addition of a “long haul premium” and are currently no longer tied to historical standards.
[VISUAL DATA REPRESENTATION: Imagine a line graph where the blue line (Historical Suez Average) stays flat, while the red line (2026 SCFI Spot Rates) shows a jagged, upward trajectory, peaking during the Q3 peak season.]
Operational Impacts: Managing Transit Time Delays and Blank Sailings
The Ripple Effect: Blank Sailing Schedule Asia-Europe
To manage the current state of chaos, carriers have been creating a blank sailing schedule Asia-Europe. When a vessel is delayed by 2 weeks during its transit around Africa, it misses its return voyage vessel slot in Asia. The carriers simply blank that slot to “fix” the schedule. This process creates artificial capacity shortages, therefore, keep freight rates elevated during periods of soft demand.
Quantifying Transit Time Delays for Just-in-Time Inventory
As an average importer, you can visualize how a 14-day delay results in a nightmare if you have a lean inventory model.
The Math: Your lead time was 35 days, now there is an additional 14-20 days added (49-55).
The Impact: To mitigate risk of stock-outs: Have to increase the charts below provide “Planned ETA” & “Actual Arrival”; and show a consistent 14-day variance driven by “Transit Time Delay” impacting the Inventory Turnover Ratios.
The Infrastructure Bottleneck: Port Congestion at Tanger Med and Durban
According to the semi-annual report provided by the National Association of Port Authorities, Tanger Med and Durban were not built to support the massive surge of diverted cargo caused by COVID-19; and therefore both ports are suffering from extreme port congestion — due to the inability to accommodate the large, frequent vessel arrivals at these ports, both have run out of berth space and cranes to assist the vessels arriving.
Strategic Rerouting: How Shippers Are Utilizing Secondary Transshipment Points
Shippers that are forward-thinking have taken their transshipments beyond major hub ports. Many are now taking advantage of smaller regional ports to serve as transshipment points. While this represents an additional leg of the supply chain / logistics network, it does provide shippers with a potential time savings of 5 to 7 days of waiting at anchor.
What Didn’t Work For Me
I started 2025 with an intention to use a “single provider” logistics plan to reduce my administration costs and figured I would be treated preferentially because I was a loyal customer. I learned the hard way that when blank sailings occur my cargo was the first to be rolled; and carriers are naturally going to prioritize high-volume contracted customers first. I also learned that loyalty will not be rewarded when there is a shortage of vessel capacity. You should spread your risk over three or more different carrier alliances.
Edge Case: The “Ghost” Capacity Problem in 2026
Undocumented Workarounds: Managing Equipment Imbalance in Non-Traditional Ports
We have seen a substantial decrease in the availability of empty containers at non-traditional ports because vessels are now bypassing their traditional routes and empty box “repositioning” has halted. Therefore, if you are shipping from a non-traditional port, you may need to pay a premium just to have an empty container delivered to your location.
Mitigating Hidden Costs: Beyond the Freight Rate
Do not only consider the ocean freight rate, but also take into account demurrage and detention charges. If your freight gets stuck at a congested port, those charges will consume your margins quicker than the ocean freight rate will.
Best Practices for Supply Chain Resilience in a Volatile Market
Diversifying Carrier Portfolios to Hedge Against Route Disruptions
Do not put your eggs into one basket in an alliance. Instead use a variety of carriers:
Global Carriers: For volume and reliability.
Regional Niche Carriers: For flexibility in secondary ports.
Air Freight/Sea-Air Hybrids: For high-value, time-sensitive inventory.
Leveraging Real-Time Visibility Tools for Proactive Inventory Planning
You need a control tower model and the tools must be integrated with the carrier APIs to provide real-time updates.
[VISUAL DATA REPRESENTATION: A workflow diagram showing: 1. Origin Port -> 2. Real-time AIS Tracking -> 3. Automated Alert for Delay -> 4. Trigger Contingency: Switch to Rail/Truck for final mile -> 5. Inventory Adjustment.]
Frequently Asked Questions
How do rising insurance war risk premiums impact the final landed cost of goods for small businesses?
They are a direct tax on the small business owner and could potentially add 5-10% to the ending landed cost of one unit, which would wipe out the profit margin if the retail pricing was not adjusted for it.
Are the current transit time delays at major hubs expected to normalize by the end of 2026?
The infrastructure must be built over time; therefore, if the geopolitical situation were to stabilize today, it would take an additional 12-18 months of rebalancing the global fleet.
What specific data points should investors monitor to predict the next shift in global container freight volumes?
SCFI rate spikes.
Vessel tracking data for the number of ships rounding the Cape.
Port throughput reports for Tanger Med and Durban.





2 Comments